V2 Retail Share Price Crash: 20% गिरावट, Q2 FY27 Update
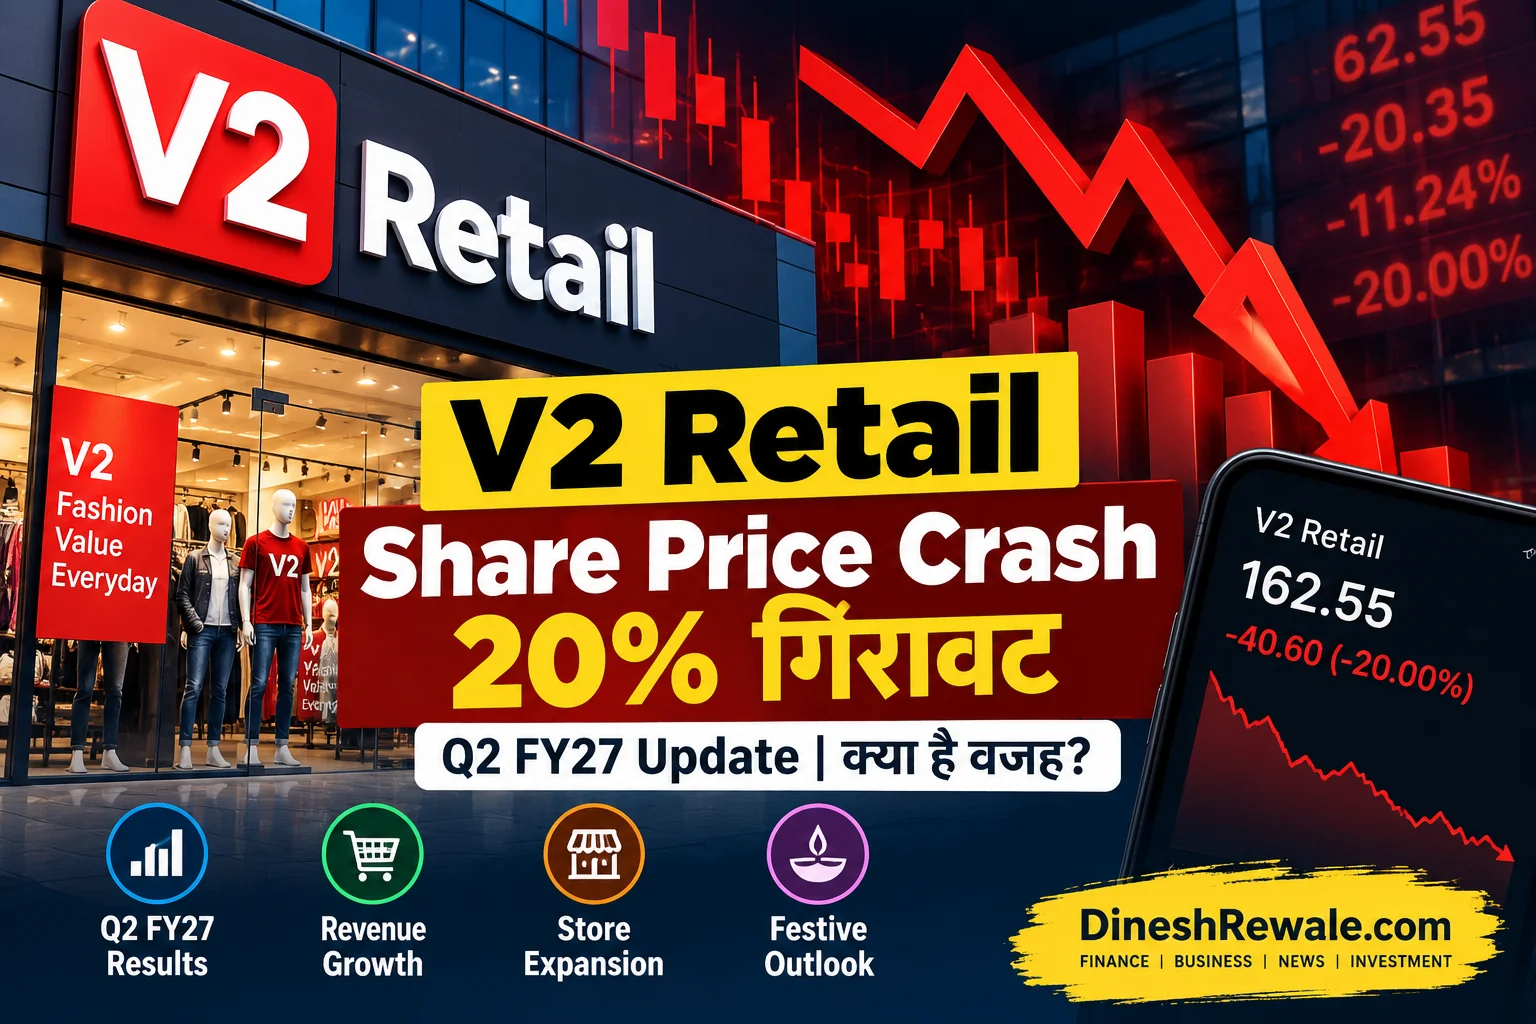
5 अक्टूबर 2026: V2 Retail के शेयरों में सोमवार को तेज गिरावट देखने को मिली। Q2 FY27 business update आने के बाद stock करीब 20% तक गिरकर BSE पर ₹162.55 के intraday low तक पहुंच गया। दिलचस्प बात यह है कि कंपनी ने इसी quarter में standalone revenue में 28.4% YoY growth दर्ज की है। Market reaction का मुख्य सवाल revenue growth से ज्यादा sales productivity और festive timing को लेकर है।
2 अक्टूबर 2026 को जारी Q2 FY27 business update के अनुसार V2 Retail का standalone revenue ₹905 करोड़ रहा, जो पिछले साल के ₹705 करोड़ से 28.4% ज्यादा है। लेकिन same-store sales growth (SSSG) calendar basis पर -14.9% रही, जबकि festival-normalised basis पर यह 0.5% थी। Navratri और Durga Puja की timing में बदलाव भी इस comparison को प्रभावित कर रहा है।
In Short: V2 Retail Share Crash
| Indicator | Q2 FY27 Update | क्या समझ आता है? |
|---|---|---|
| Standalone Revenue | ₹905 करोड़ | 28.4% YoY growth |
| Festival-normalised SSSG | 0.5% | Underlying same-store growth लगभग flat |
| Calendar-basis SSSG | -14.9% | Festival timing का बड़ा असर |
| Monthly Sales / Sq Ft | ₹700 | Q1 से कम |
| Total Stores | 427 | Rapid network expansion |
| H1 FY27 New Stores | 106 | Expansion remains aggressive |
V2 Retail Share Price आज क्यों गिरा?
Market ने केवल revenue growth को नहीं देखा। Investors ने same-store sales, sales per square foot और नए stores की productivity पर ज्यादा ध्यान दिया। Revenue growth का एक बड़ा हिस्सा बढ़ते store network से आया है, जबकि festival-normalised same-store growth 0.5% रही। इस combination ने growth की quality को लेकर caution बढ़ाया।
Monday के session में stock का गिरना इसलिए भी महत्वपूर्ण है क्योंकि intraday low ₹162.55 तक गया। ET के market data में सुबह 9:19 बजे V2 Retail ₹175.75 पर था, जो previous close ₹201.39 से 12.74% नीचे था। अलग-अलग समय पर intraday percentage बदल सकता है, इसलिए market-close data को final reference माना जाना चाहिए।
Q2 FY27 में V2 Retail का Revenue कितना बढ़ा?
V2 Retail का Q2 FY27 standalone revenue ₹905 करोड़ रहा। पिछले साल इसी quarter में revenue ₹705 करोड़ था। यानी साल-दर-साल करीब 28.4% growth हुई। Company ने यह भी बताया कि store network expansion इस growth का महत्वपूर्ण driver रहा।
Same-Store Sales Growth का असली मतलब क्या है?
SSSG किसी retail company के existing stores की sales performance को समझने में मदद करता है। यह नए stores जोड़कर मिली growth से अलग picture दिखा सकता है। V2 Retail के Q2 update में calendar-basis SSSG -14.9% था, लेकिन company ने festival-normalised basis पर 0.5% growth बताई।
इस फर्क की वजह festival calendar है। पिछले साल Navratri और Durga Puja का बड़ा हिस्सा Q2 में था, जबकि 2026 में ये festivals October में यानी Q3 FY27 में आए। इसलिए year-on-year calendar comparison में Q2 कमजोर दिखाई देता है।
Festival timing से numbers पर कितना असर पड़ा?
Value-fashion retail में festive quarter sales के लिए महत्वपूर्ण हो सकता है। इस साल V2 Retail के Q2 में Navratri और Durga Puja का benefit नहीं था, जबकि पिछले साल इन्हीं दिनों ने Q2 sales comparison को support किया था। Company को उम्मीद है कि festive demand का बड़ा हिस्सा Q3 FY27 में capture होगा।
V2 Retail ने कितने नए Stores खोले?
30 सितंबर 2026 तक V2 Retail के कुल 427 stores थे। Company के अनुसार H1 FY27 में 106 stores जोड़े गए, जबकि Q2 में 49 नए stores खोले गए और 3 stores बंद हुए। कुल retail footprint करीब 46.28 लाख square feet तक पहुंच गया।
Monthly Sales Per Square Foot क्यों महत्वपूर्ण है?
Retail business में sales per square foot store productivity का useful indicator है। V2 Retail का Q2 FY27 monthly sales per square foot ₹700 रहा। पिछले quarter में यह figure ₹886 था। हालांकि quarter की festive timing और बड़ी संख्या में नए stores ramp-up stage में होने के कारण direct quarter-to-quarter comparison को context के साथ देखना चाहिए।
V2 Retail का Q3 Outlook क्या है?
Company ने festive season ahead होने को Q3 के लिए opportunity बताया है। Navratri और Durga Puja का timing Q3 में आने से management को demand uplift capture करने की उम्मीद है। साथ ही बढ़ता store network आने वाले quarters में additional growth opportunity दे सकता है।
Investors को अब किन संकेतों पर नजर रखनी चाहिए?
- Q3 same-store sales: festive quarter में existing stores की sales कितनी बढ़ती है।
- Sales productivity: sales per square foot ₹700 से improve होती है या नहीं।
- New-store ramp-up: 106 नए H1 stores revenue और profitability में कितना योगदान करते हैं।
- Margin performance: expansion के साथ operating efficiency कैसी रहती है।
- Festive demand: Q3 में Navratri और Durga Puja से expected uplift वास्तव में कितना मिलता है।
क्या V2 Retail Share खरीदना चाहिए?
सिर्फ एक दिन की share-price गिरावट या Q2 business update के आधार पर किसी stock को buy या sell करने का फैसला लेना उचित नहीं है। V2 Retail के मामले में revenue growth मजबूत रही है, लेकिन same-store growth और store productivity जैसे indicators को भी साथ में देखना जरूरी है।
किसी भी investment decision से पहले latest quarterly results, valuation, debt, cash flow, margins, management commentary और अपने risk profile को ध्यान में रखें। यह article stock recommendation नहीं है।
V2 Retail और Retail Sector को समझने के लिए आगे क्या पढ़ें?
Retail और business growth को समझने के लिए आप DineshRewale.com के Share Market Today page के साथ Asset Allocation, Financial Freedom और Emergency Fund के बाद Investment guides भी पढ़ सकते हैं।
निष्कर्ष
V2 Retail share price में 5 अक्टूबर 2026 को तेज गिरावट आई, लेकिन quarterly picture पूरी तरह negative नहीं है। Revenue ₹905 करोड़ तक बढ़ा और network expansion तेज रहा। दूसरी तरफ festival-normalised same-store sales growth सिर्फ 0.5% रही और sales productivity पर नजर रखना जरूरी है।
अब सबसे महत्वपूर्ण test Q3 FY27 रहेगा, क्योंकि इस quarter में Navratri और Durga Puja की festive demand शामिल होगी। अगर same-store growth और new-store productivity बेहतर होती है, तो market को underlying growth quality का clearer signal मिल सकता है।
महत्वपूर्ण स्रोत
- V2 Retail Limited: Official Investor Information
- Economic Times: V2 Retail Share Price
- Economic Times: V2 Retail Q2 Business Update
- NDTV Profit: V2 Retail Share Price Update
Author: Dinesh Rewale
Dinesh Rewale is a blogger and digital content creator who writes about personal finance, business, investments, technology and current updates in simple, reader-friendly language.
Facebook पर Dinesh Rewale
Disclaimer: यह article केवल general informational और educational purpose के लिए है। Share price और business conditions तेजी से बदल सकती हैं। यह stock recommendation या personalized investment advice नहीं है। Investment decision लेने से पहले latest filings, financial results और अपने risk profile को consider करें।